Some results from the Newsletter No. 2 – September 2013
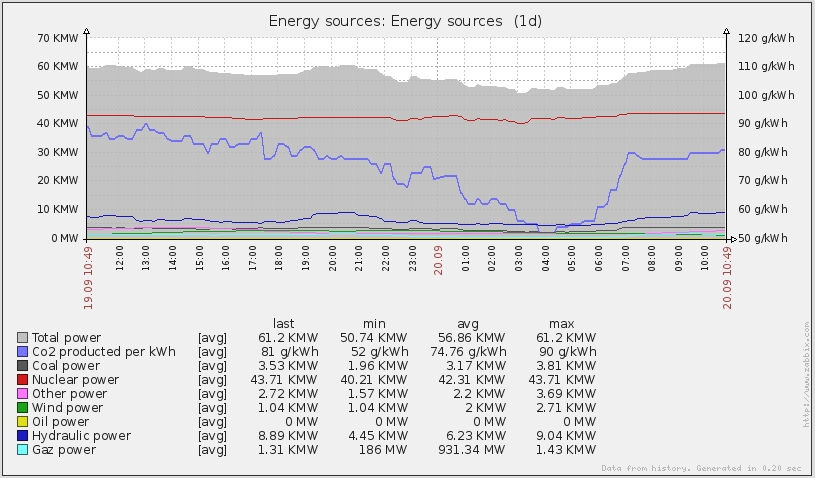
This screenshot from infrastructure monitoring at Inria’s testbed illustrates how variable CO2 cost of energy can be. This data, taken from the live feed from France’s electricity transport company (RTE) is made available to the higher levels of the Eco2Clouds stack, as well as to users to as to enable optimization strategies.
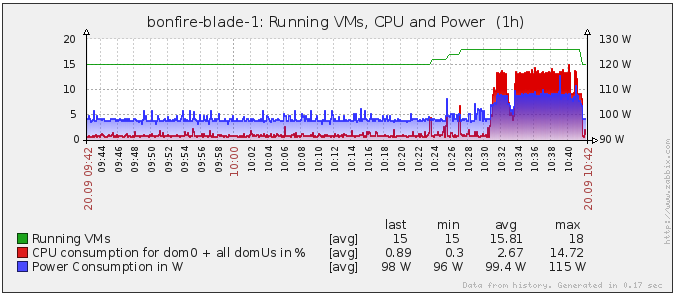
This second screenshot illustrates the variability of power consumption on infrastructure nodes according to the number of VMs running (green line) and their activity (red line). It is by combining the data from these two graphs (and more) that CO2 costs can be attributed to running VMs.